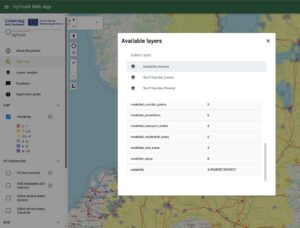
The HyTruck spatial planning toolkit aids decision makers in planning locations for hydrogen refueling stations. Using the layers menu on the left, users can view relevant data layers like current hydrogen station info, power stations, Ten-T and different modelling results. The app is available at https://hytruck.landscape-geoinformatics.eu
The Hytruck spatial planning toolkit provides consolidated GIS data to support the decision-making process. GIS data sources are selected based on the expert recommendations and include the locations of power plants, highways, fuel stations, etc. The user can choose the layers on the left-hand side of the web panel, and the corresponding data will be shown on the web app’s map area. When the user clicks on the map, it shows all the data for the region of the selected layers, which the user can support with an integrated view of information.
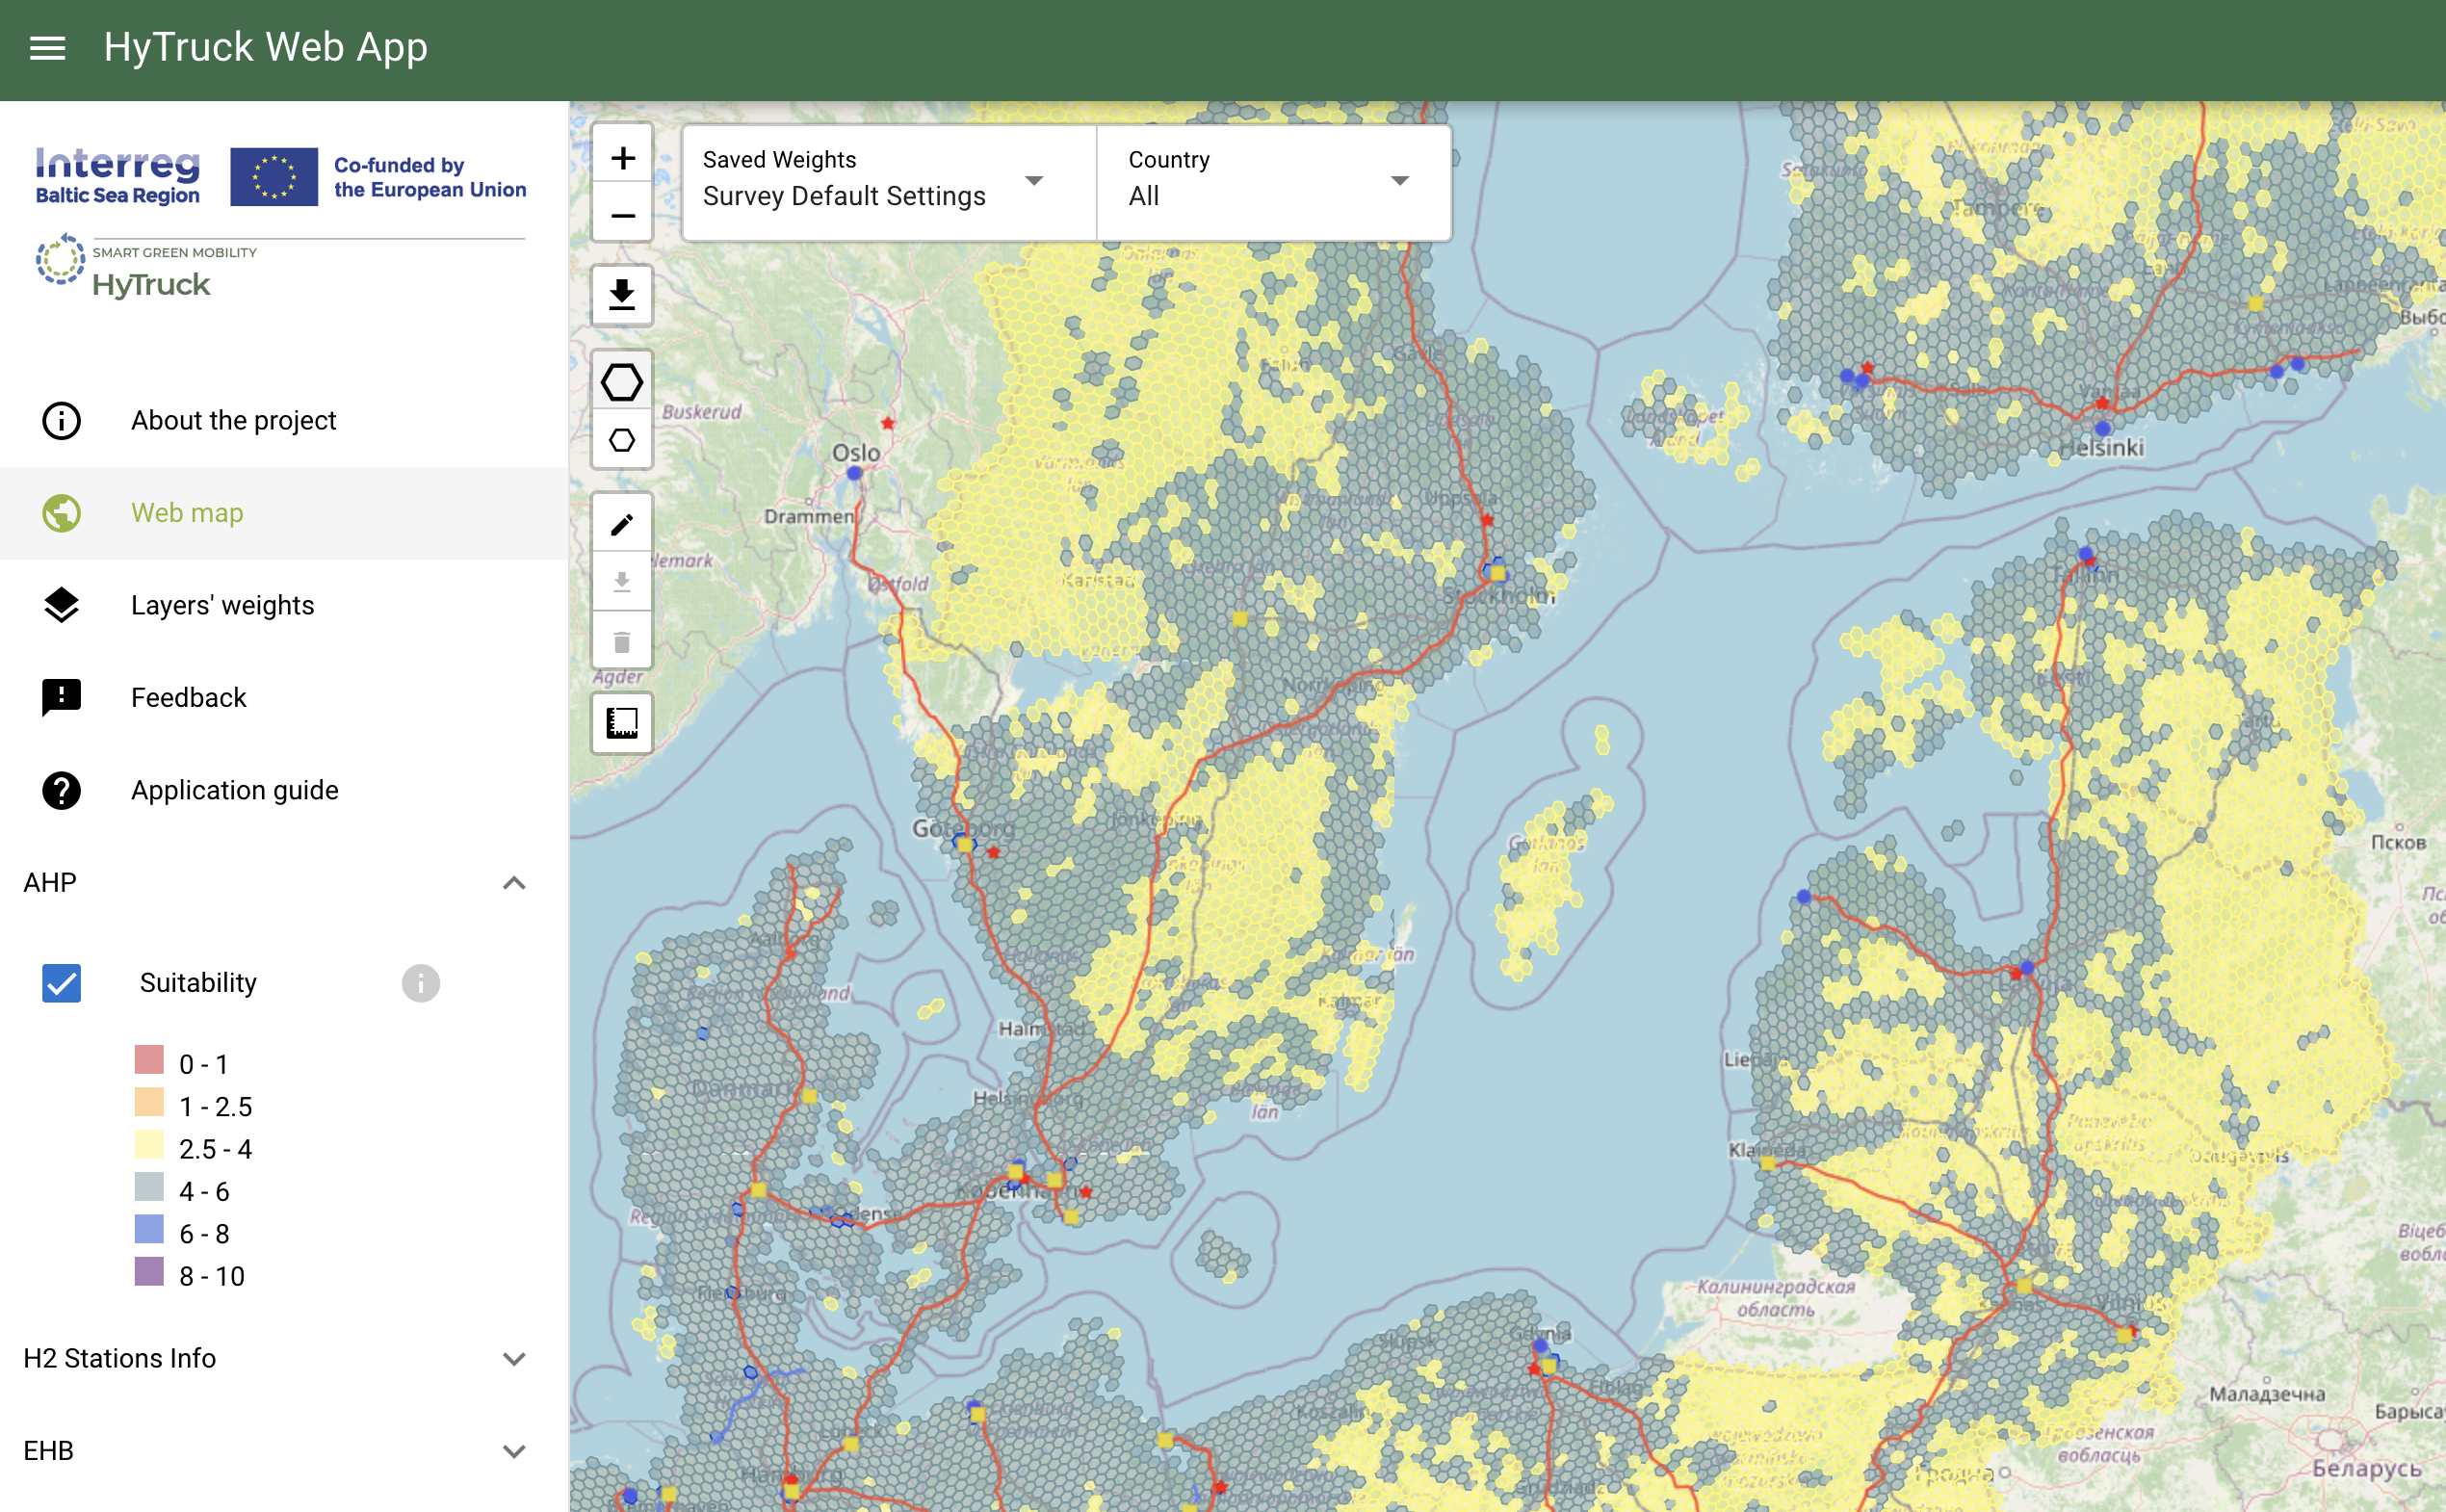
The layer ‘Suitability’ is of particular interest as it shows the hexagons with suitability for opening a hydrogen refueling station in that area. Hexagon sizes are always equal within the same zoom level. The zoom level and the corresponding hexagon resolution can be changed manually by clicking the hexagon buttons on the toolbar next to the layer menu and by zoom in and out. More information on data, access, and methods can be found at: https://hytruck.landscape-geoinformatics.eu/docs/
Suitability weights are precalculated into two different weighting settings for criterion prioritization: AHP and Survey-based. The AHP-based suitability model was informed by scientific literature, and in conjunction a survey was conducted with professionals currently working to open hydrogen refueling stations in the Baltic Sea, this informed the second model. Both methods agreed that areas around major cities are the most suitable location. Using two methods revealed the disconnect between implementing an ideal HRS network and what is technically feasible.
You can find more details about the data sources on: https://hytruck.landscape-geoinformatics.eu/docs/data_references/